|


 |  |
|
| |
 | Alpinism | Arta cultura | Diverse | Divertisment | Film | Fotografie |
| Muzica | Pescuit | Sport |
The PBL (Planetary Boundary Layer) is the
lowest part of the troposphere and plays an important role in our everyday
live.
Diverse applications of boundary-layer meteorology require better
understandings of the PBL. The depth
of the PBL varies greatly in space and time, but knowledge of the depth of
PBL aid in the validation of parameterizations of the PBL in general
circulation models and improve our abilities to model the coupling between the
atmosphere and the Earth's surface. The PBL depth is most easily calculated by
looking at a thermodynamic sounding, but there are many other new methods for
doing this. Two methods have been used in this work to show that LIDAR
provides accurate measurements of the top of the boundary layer: (i) thermodynamic sounding; (ii) the
bulk-Richardson number and
Keywords: Planetary Boundary Layer Depth, radiosoundings, LIDAR,
1. Introduction
The Planetary Boundary Layer (PBL), has an important role for the whole atmosphere-earth system because it acts as the interface where the coupling between the atmosphere and the Earth's surface occurs, and the depth of the PBL controls the transfer of momentum, heat and moisture between them. The planetary boundary layer (PBL) contains most of the aerosol and water vapor in the atmosphere and thus has a major influence on radiative fluxes. Studies of climate sensitivity, therefore, require careful consideration of the role of the PBL. Environmental applications also include long-term air-quality and climate modeling, air chemistry, and meteorological forecast modeling.
The top of
the PBL has been given many names; the most popular being inversion height,
mixing height and mixed-layer depth. The commonality exists in
that they all refer to the greatest depth to which atmospheric constituents are
well mixed. The PBL is usually
within a
Strawbridge, K. B. and B. J. Snyden [1] shown that lidar has been shown for many years to provide accurate measurements of the top of the boundary layer. Aside from being clearly visible on lidar plots, determining the PBL height from lidar data does not require the more difficult task of obtaining an absolute calibration of the system. Several methods have been employed to extract the PBL height from lidar data. These include critical threshold techniques, gradient techniques, wavelet analyses and techniques using idealized profiles. The fundamental premise takes advantage of the large gradient in aerosol concentration generally evident between the boundary layer aerosols and those found in the free troposphere.
There are many different ways of acknowledging and accounting for the PBL.
The height of the
PBL is calculated using the bulk-Richardson number [2](Troen
and Mahrt, 1986) and
The
bulk-Richardson number is the ratio of convective available potential energy (
The
Radiosoundings are
the most common data source to retrieve the Atmospheric Boundary Layer (ABL)
height, based on wind, temperature and pressure profiles but, in
The lidar signal shows a strong backscattering within the ABL, decreasing through a transition zone and becomes weak in the free troposphere. This behavior is the base for the lidar estimation of the ABL height. Usually, the transition zone can be assumed to be proxy for the temperature inversion (Brooks, 2003). But interpreting data from lidar must take account on the advection of air mass which can change the vertical mixing.
Consequently, we
determined the PBL height by using lidar profiles obtained with lidar system
presented in Section 2.In Section 3 we have compared the lidar profiles with the
radiosoundings and
2. Lidar system and lidar profiles
2.1. Lidar system
The lidar system named LISA (LIght Scattering Aerosol) is based on a Nd:YAG laser working at the 1064 nm fundamental wavelength and at 532 nm second harmonic delivering pulse with high repetition rate. The system can detect micron size aerosols from far distances, with a very god spatial resolution. It is used for lower troposphere studies, including the planetary boundary layer.
Main characteristics of LiSA system are:
Emitter: Nd:YAG laser LS‑2131, Working wavelengths:1064, 532 nm; Pulse energy at 1064 nm up to 100 mJ; Pulse energy at 532 nm up to 50 mJ; Pulse repetition rate-20 Hz; Pulse duration (at level 0.5):10‑12 ns; Range: up to 10 km; Spatial resolution:3 m; Number of receiving channels:2
2.2. Methods used to determine PBL height from LIDAR data
The lidar
measurements were made at ROMEXPO, northwestern part of
Active remote sensing systems such as lidar use aerosols as tracers of the Atmospheric Boundary Layer dynamics. The lidar signal shows a strong backscattering within the mixed layer synonym with planetary boundary layer. It decreases through a transition zone between atmospheric boundary layer and the free atmosphere. This zone is often named Entrainment Zone (Stull,1988).
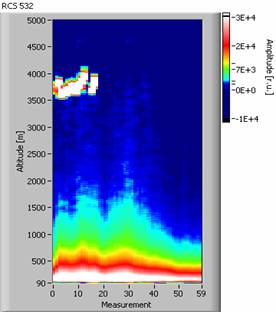
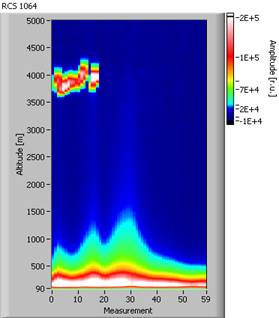
Fig. 3: Range Corrected Signal (a.u.) - temporal
evolution - on April 5th 16:00 UTC, 532 nm sounding wavelength. Fig. 4: Range Corrected Signal (a.u.) - temporal
evolution - on April 5th 16:00 UTC, 1064nm sounding wavelength
Strawbridge, K. B. and B. J. Snyden (2004) shown that lidar has been shown for many years to provide accurate measurements of the top of the boundary layer. Aside from being clearly visible on lidar plots, determining the PBL height from lidar data does not involve the more difficult task of obtaining an absolute calibration of the system. Several methods have been employed to extract the PBL height from lidar data. These include critical threshold techniques, gradient techniques, wavelet analyses and techniques using idealized profiles. The fundamental premise takes advantage of the large gradient in aerosol concentration generally evident between the boundary layer aerosols and those found in the free troposphere.
We used the RCS profiles and backscattering coefficient dependence of altitude for
Fig. 2: Backscattering coefficient on April 5th,
1064 nm sounding wavelength - dust intrusion at 3000 - Fig. 1 Backscattering coefficient on April 5th,
532 nm sounding wavelength - dust intrusion at 3000 -

The top of the PBL is often marked with a temperature inversion, a change in air mass, a hydro-lapse, and change in wind speed and/or a change in wind direction. The PBL is most definable in situations where differential advection is occurring or when a shallow front is at the surface. At the top of a front, there is an abrupt change in air mass. In some cases the transition between the PBL and free atmosphere is not well defined. However, a general height of the PBL can be determined by looking for subtle changes in dew point (or equivalent potential temperature) and wind speed/direction.
Inversions traps air within the PBL and do not allow convection to occur into the middle and upper atmosphere. Change in air mass and the temperature inversion can be observed on the available radio-soundings performed by National Meteorological Service at 00 hour (Fig.2) for the days 5-6 in April 2006.
From atmospheric state curves one can observe the equivalent
potential temperature inversion, at 1300m, and a warm air mass advection in
24 hours. This means the upper limit of the atmospheric boundary layer in
these days is closed to 1300m. The air circulation is southwest and the humidity is very small,
under 30 percents. These prove the Saharan dust intrusion observed on
LIDAR imagines.????!!!! The radio-sounding data were also used to calculate the
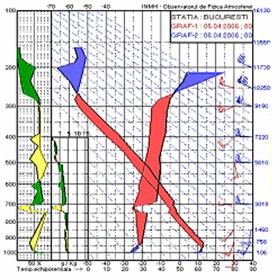
Fig.2. The radiosounding
on
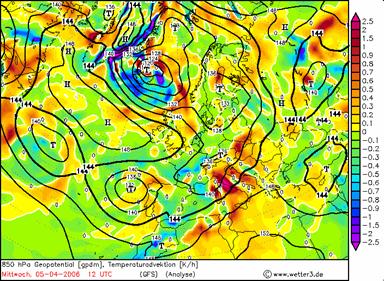
Interpreting data from LIDAR it is necessary to taking into account that meteorology and consequently origin of air mass influenced the state of the atmosphere and the height of local ABL. The type of air circulation and the change of air mass can be observed in synoptic and absolute and relative geopotential maps (Fig.3). The warm air mass advection is better observed in figure 4, the map for 850 hPa level.
Fig.3. MSL (mean sea level pressure)
500hPa geopotential height, and H500-H1000gpdm, relative geopotential at 00
UTC on 06.04.2006.

Fig.4. 850hPa (~1500m) geopotential height, and
1200 UTC on 5.04.2006. One can observe the warm
air advection.
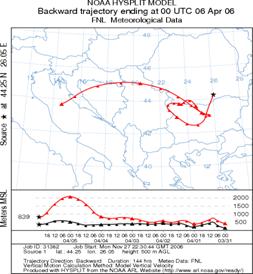
In addition, to emphasize the change in air mass and consequently the intrusion of Saharan dust, kinematics backward trajectories have been invoked. The version 4 of the Hybrid Single -Particle Lagrangian Integrated Trajectory model (HYSPLIT), developed by the National Oceanic and Atmospheric Administration (NOAA)'s Air Resources Laboratory (ARL) (Draxler and Hess, 1998; Draxler and Rolph, 2003; Rolph, 2003) was used.
The backward trajectories are shown in Fig. 5a,b and can
be observed the change in trajectory at altitude on April 05 2006.??? These maps clearly identifies the Saharan origin of the
upper air-masses. Saharan dust layers reach the southern part of
 trebuie refacute! Nu apar traictoriile pentru nivele!
backtrajectories arriving at 300 and 839m at 00 UTC.
The height of the PBL determined from LIDAR data was also compared
with the values determined using the bulk-Richardson number (Troen and Mahrt,
1986). The bulk-Richardson number is the ratio of convective available
potential energy (
![]()
where
g is the acceleration due to gravity, z0 the height of the
surface, ![]() the potential
temperature and u and v the zonal and meridional wind components.
the potential
temperature and u and v the zonal and meridional wind components.
The height of mixed layer (ML) is defined as the height where the bulk-Richardson number becomes equal or larger than the so-called critical bulk-Richardson number, which has a value of 0.21(Vogelezang and Holtslag, 1996; Menut et al., 1999).
Beyond this critical value
the atmosphere can be considered fully decoupled from the mixed layer, ML (the PBL height).The calculated value from
radio-sounding data was 0.54, for
The
where V is horizontal component of the wind vector, ![]() .
.
The
Fig.6.
4. Summary and conclusions
The differences between the values of the PBL height determined from LIDAR data and radio-soundings ( temperature inversion method) can be explained by the fact that the lidar -derived transition zone does not respond directly to the thermodynamic properties of the atmosphere.
In this case the height of the detected layer is the
results of the advection of air mass and not to vertical mixing. Layer was
formed when aerosol was injected by air mass from northern part of
Mai completez dupa ce lamurim metoda cu lidarul.
References
Strawbridge, K. B., B. J. Snyden, 2004. Planetary boundary layer height determination during Pacific 2001 using the advantage of scanning lidar instrument. Atmospheric Environment 38, 5861-5871
1.Glickman, Todd ed. Glossary of
Meteorology. American Meteorological Society:
2.Stefan S., 1998:
4.Stull, Roland B. 1988. An Introduction to Boundary Layer Meteorology, Kluwer Academic, 666pg.
5.Troen,
Copyright © 2024 - Toate drepturile rezervate